Stop guessing if your protocol is working
Log testosterone, oestrogen, SHBG, cholesterol, and more. See exactly how your levels respond to treatment over months -- not just a snapshot from one test.
Start Logging Blood TestsTestosterone Over Time
Example: levels across 5 months with reference range
Illustrative data. Your charts reflect your actual bloodwork.
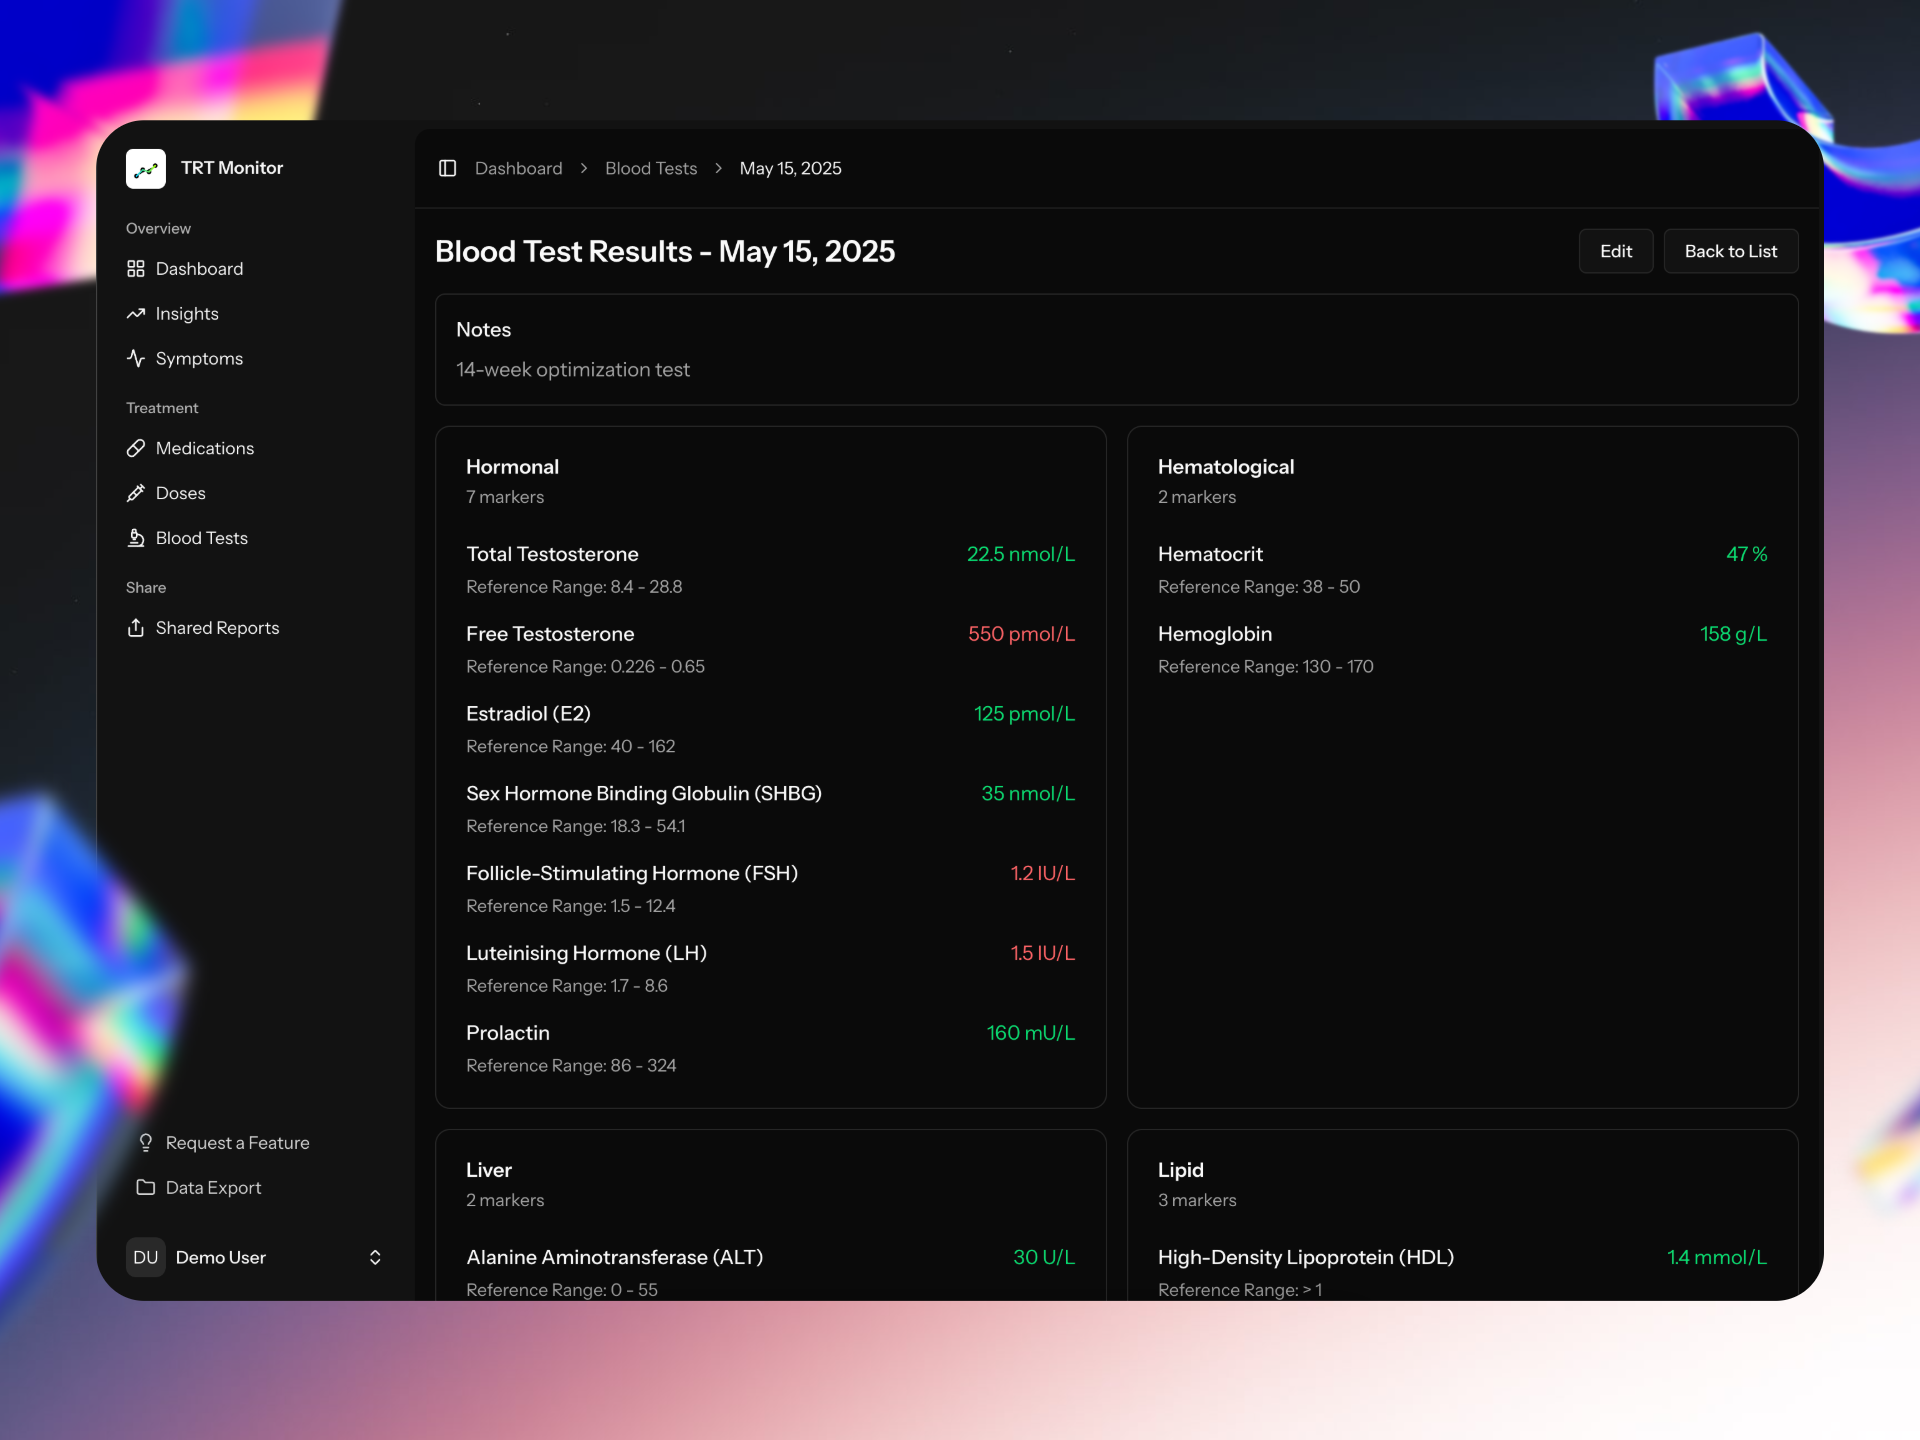
Your data, clearly presented
Markers are colour-coded against reference ranges. See at a glance what's optimal, what's high, and what needs attention.
Blood Test - May 1, 2025
Built for serious bloodwork tracking
Grouped marker logging
Add multiple markers from a single blood test in one go.
Organised by category
Hormonal, lipid profile, liver function, haematology and more.
Custom reference ranges
Use standard ranges or set your own based on your doctor's guidance.
Feeds into insights
Connect bloodwork with symptoms and doses for deeper understanding.
See how your body responds to treatment
Free for 1 month. No credit card required.