Understand what your data is telling you
Go beyond simple tracking. TRT Monitor connects the dots between your bloodwork, symptoms, and medication schedule, revealing patterns that help you and your doctor understand your therapy.
Symptom Score Trend
Example: mood and energy over 4 weeks
T-Level vs Libido
Example: correlation between testosterone and libido
Illustrative data. Your charts reflect your actual health data.
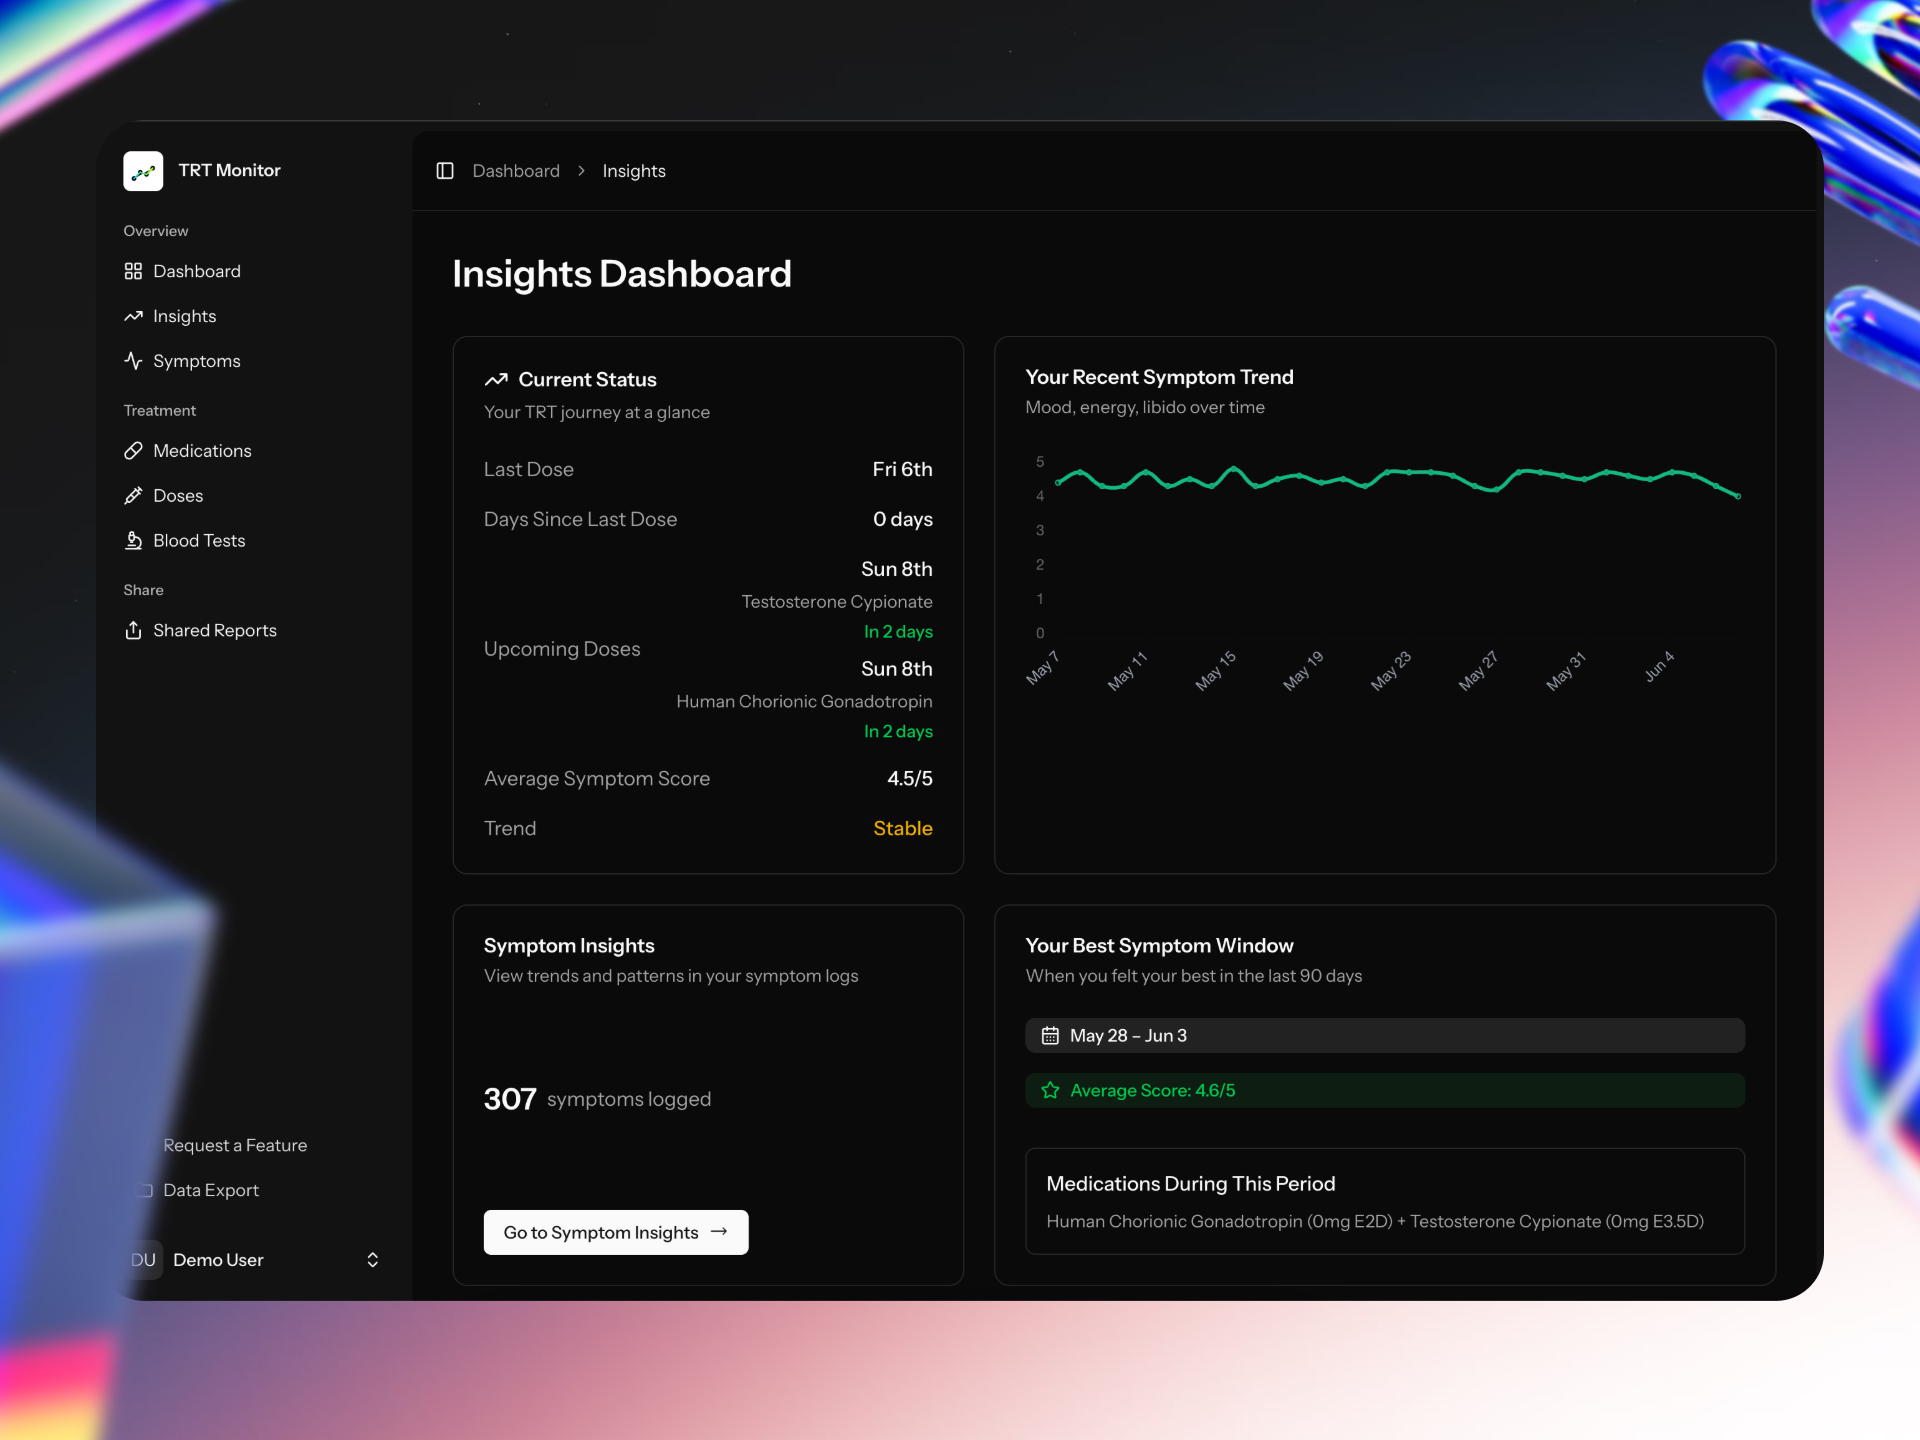
Your health, visualised
Our main dashboard brings all your key data together for at-a-glance understanding.
Go beyond raw numbers
TRT Monitor analyses your symptom logs, blood test results, and medication schedules to provide actionable feedback.
Toggle between grouped views for categories (e.g., mental health) and individual symptom trends. Use line charts for daily logs, bar charts for weekly averages, and more.
Symptom trends
View mood, energy, libido patterns over time
Bloodwork analysis
Track key markers and compare to reference ranges
Protocol impact
See how dosage changes affect how you feel
Correlation Found: Libido and Trough Levels
Your libido scores tend to be highest 1 day before your scheduled injection. This could be valuable for your next consultation.
Alert: Consistently Low SHBG
Your last three blood tests have shown SHBG below the reference range. You may want to discuss this trend with your physician.
Actionable insights, tailored to you
Get tailored feedback based on your unique data profile. Our insights engine identifies meaningful patterns, moving beyond guesswork so you can understand your protocol with confidence.
Understand the specific factors that truly impact your well-being -- and share the findings in a shared report for your next clinic visit.
Clear visualisations, built for insight
Grouped vs individual views
Toggle between average scores for categories and individual symptom trends.
Multiple chart types
Line charts for daily logs, bar charts for weekly averages, scatter plots for correlations.
Mobile-ready insights
Access all your insights and charts on the go with a fully responsive layout.
Cross-data correlations
See how bloodwork, symptoms, and doses interact for deeper understanding.
Discover your health story
Free for 1 month. No credit card required.